Fake Metrics Don't Make You Feel Better
Fake metrics don't just miss the target — they point you at the wrong one. And you run hard in the wrong direction, feeling productive the whole way.


They don't just fail you. They send you in the wrong direction. They give you false hope. They send you chasing down rabbit holes when all you need is Alice.
Here's what a fake metric actually does: it tells you something is fine when it isn't, or broken when it's not, or changing when it's standing still. It doesn't just miss the target — it points you at the wrong one. And you run. Hard. In the wrong direction. Feeling productive the whole way.
The Leaky Barrel
Picture a rainwater barrel. Water flows in from the roof. Water flows out from the tap. And there's a leak — slow, invisible, somewhere near the bottom.
You check the water level. Looks the same as yesterday. Same as last week. So you think nothing's changing.
But everything's changing. The inflow rate shifted because it hasn't rained. The leak is getting wider. The tap usage went up. Three forces moving in three different directions, and the level — the only thing you're measuring — happens to look stable. It's a coincidence disguised as a fact.
This is what fake metrics do. They show you one number — weight, followers, revenue, tasks completed — and you mistake that surface reading for the whole system. Meanwhile, underneath, the flows are shifting constantly. Just like walking down a street — your position and the direction you need to travel are changing with every step. But you're staring at the map you printed at home and wondering why nothing looks right.
We're using the wrong tools. Not broken tools — wrong tools. A rain gauge when we need a flow meter. A snapshot when we need a system diagram.
Weather Reports vs. Barometers
A weather report describes conditions. A barometer measures the forces that create them.
"It's raining" is useful if you need an umbrella. Useless if you want to know why, how long, and what's coming next. A barometer reads atmospheric pressure — the invisible thing driving the system. It doesn't care what the sky looks like. It measures what the sky is doing.
The entire self-help industry is a weather report. "You're stuck." "You're burned out." "You're overwhelmed." Billions of dollars confirming conditions you can already feel. Nobody hands you an instrument and says: measure the pressure. Find the specific thing that's broken. Fix that.
This pattern is everywhere.
Five Places We Chose Weather Over Pressure
Pain Scale vs. MRI
The pain scale asks "how much does it hurt?" The MRI asks "what's broken?"
A 7 from a kidney stone and a 7 from a herniated disc aren't the same 7. One number, two completely different problems, two completely different treatments. Measuring intensity without locating the source means everyone gets sympathy and nobody gets a diagnosis.
BMI vs. Body Composition
BMI says "overweight." A DEXA scan says "here's your bone density, muscle mass, and fat distribution."
BMI can't tell the difference between a bodybuilder and someone who hasn't left the couch since 2019. We built entire health policies on a number that describes a shape and mistakes it for a condition.
GDP vs. Wellbeing
GDP goes up after a natural disaster. It goes up when people get sick. It goes up when couples divorce. It measures activity. It cannot tell the difference between a hurricane and a harvest.
A number that rises during catastrophe isn't measuring health. It's measuring motion.
Followers vs. Engagement
Your dashboard glows green. Followers up. Impressions up. Views up.
Nobody's buying. Nobody opens your emails. Nobody remembers your name a week later. Vanity metrics are the "I'm so busy" of marketing — impressive at dinner, meaningless at the bank.
Hours Worked vs. Things Finished
"I worked 80 hours this week." What shipped? "Nothing yet, but I'm putting in the time."
Hours measure presence. Completion measures progress. The gap between them is where entire careers go to die quietly — drowning in effort, starving for output.
The Pattern
Every one of these is the same mistake: measuring the surface and calling it a diagnosis.
Pain level without location. Weight without composition. Economic activity without wellbeing. Audience size without connection. Time spent without things finished.
And every one of them feels like information. That's the trap. Fake metrics give you the shape of understanding without the substance. They let you feel productive without being effective, informed without understanding, busy without finishing.
They are anchors disguised as instruments.
Why We Prefer Them
Because they're comfortable. A weather report confirms your experience without requiring you to change. "I'm stuck" is a complete sentence. It asks nothing of you.
A diagnosis — "your Will bearing is broken and you need to address that specific thing" — demands action. It takes the weather out of your hands and puts a wrench in them.
We talked about this in Stuck in a Thesaurus of Blame — how the words we use for being stuck glorify the condition instead of diagnosing it. Fake metrics do the same thing with numbers. Data-shaped comfort instead of data-shaped truth.
Build the Barometer
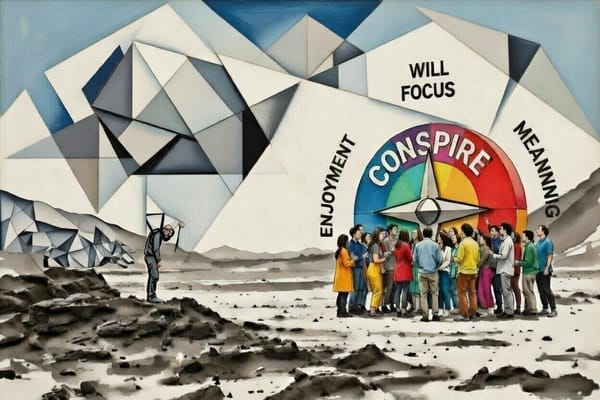
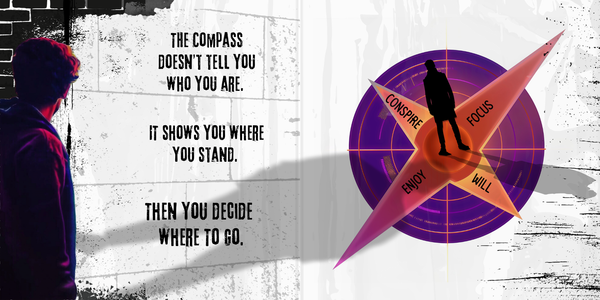
The Five Bearings — Focus, Will, Enjoyment, Conspire, Meaning — exist because I got tired of weather reports. Tired of beautiful descriptions of pain sold as progress.
A barometer doesn't care what the sky looks like. It measures the pressure system creating the weather. That's what the bearings do. Not "are you stuck?" but "where is the system broken?"
Take the quiz at quiz.endregret.com. Five minutes. No vanity metrics. Just the actual reading.
Because fake metrics don't make you feel better. Real ones make you get better.
FAQ
What makes a metric "fake"? A fake metric describes surface conditions without revealing the cause underneath. It confirms what you already feel — "I'm busy," "I'm growing" — without telling you whether anything meaningful is changing. Real metrics measure the forces driving your situation, not just the symptoms.
How do I know if I'm tracking the wrong thing? If the number keeps going up but nothing feels different, you're measuring weather. Real progress connects to outcomes you actually care about — things finished, relationships deepened, capability built. Green dashboard, empty gut? Trust the gut.
What's the connection between fake metrics and being stuck? Fake metrics make stuckness feel like progress. Crossing off tasks, logging hours, counting followers — the illusion of movement without addressing why you're not finishing what matters. They're the numeric version of the Thesaurus of Blame.
How do the Five Bearings work as a "real" metric? The Five Bearings measure specific dimensions of your completion system. Instead of "are you stuck?" they ask "which bearing is broken?" — Focus, Will, Enjoyment, Conspire, or Meaning. That diagnosis leads to a specific fix instead of generic advice.
Can fake metrics ever be useful? They're not useless — they just can't be your only instrument. Follower counts and hours worked can signal something when paired with deeper measures. The danger is when they're all you track, telling you the weather is fine while the pressure drops.
SR;MR (Slow Read; Must Reflect)
- Fake metrics don't just miss — they point you at the wrong target and you run hard in the wrong direction
- The Leaky Barrel: water level looks stable while three forces shift underneath. That's every metric you trust.
- Pain Scale vs. MRI: intensity without location = sympathy without diagnosis
- BMI vs. DEXA: a number that can't tell a bodybuilder from a couch potato
- GDP vs. Wellbeing: a metric that rises during catastrophe isn't measuring health
- Followers vs. Engagement: green dashboards, empty bank accounts
- Hours vs. Finished: presence ≠ progress, effort ≠ output
- The pattern: measuring the surface and calling it a diagnosis
- We prefer fake metrics because they're comfortable. Diagnosis demands action.
- Stop chasing rabbit holes. Find Alice.